
Advanced Indicators
Analyzing the Signs and Signals
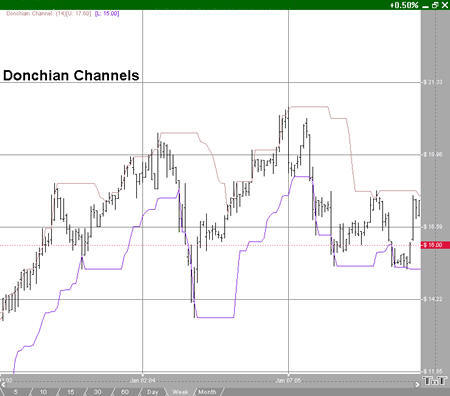
Donchian Channels (DON)
Donchian Channels were created by Richard Donchian, an expert in trends. The DON is a simple trend breakout system. The channel works well in trending markets, but not as well in sideways moving markets.
Donchian Channels measure volatility by placing bands at a specified period deviation. These bands are charted two standard deviations from the market price. As the market price changes, the value of two standard deviations also changes. This value is what comprises the Donchian Channel’s band width, representing the expanding and contracting of the bands based on recent price volatility.
Calculation
The calculation of the DON is here:
Donchian Channel High = MAX (HI, n)
Donchian Channel Low = MAX (LO, n)
Example of Donchian Channels
Preferences
Open the Preference tab from the Control Panel on the left of your screen. Select the Donchian Channels line on your screen. The preferences will appear in the Control Panel. (Once you click on the chart, the Preference tab will go back to chart settings.)
1. Restore Settings: TNT Default will change your settings back to the original software settings. My Default will change current settings to your personalized default settings. Apply To All Charts will apply your selected settings on all open charts. Save As My Default will save your current personal settings.
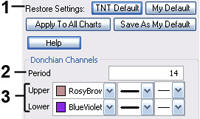
2. Donchian Period: Specify the number of days in a period.
3. Upper, Lower: Choose the color, line style, and line thickness of your indicator line.