
Bulls 'n Bears Advantage
Green Light, Red Light, Blue Light
Preferences
Open the Preference tab from the Control Panel on the left of your screen. Right-click on your chart and highlight "Overlay Properties" from the dropdown menu. Select Bulls ‘n Bears from the list and the preferences will appear in the Control Panel. (Once you click on the chart, the Preference tab will go back to chart settings.)
1. Restore Settings: TNT Default will change your settings back to the original software settings. My Default will change current settings to your personalized default settings. Apply To All Charts will apply your selected settings on all open charts. Save As My Default will save your current personal settings.
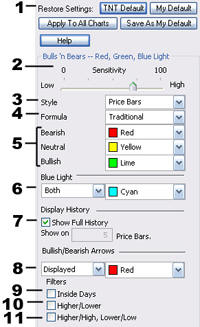
2. Sensitivity: A higher sensitivity will give you earlier bullish/bearish arrows, while a lower sensitivity will wait to give you the bullish bearish arrows until a trend is established.
3. Style: Choose the price bar style you want to view on your chart.
4. Formula: A Traditional style will widen the neutral (yellow) positions and is a more conservative approach. A Progressive style will narrow the neutral positions, and an Aggressive style will eliminate the neutral positions on your chart.
5. Bearish/Neutral/Bullish: You can change the color of the Bearish, Bullish, and Neutral price bar indicators.
6. Blue Light: Much like the Parabolic SAR indicator, the blue light indicates where to place your stop loss. You can choose to view either the bullish or the bearish indicators, or view both.
7. Show Full History: To view the bullish/bearish tendencies on all the price bars on your chart, check the box. To limit the bullish/bearish tendencies to a specific number of price bars at the end of a chart as well. Uncheck the box and enter the number of price bars you would like to view.
8. Bullish/Bearish Arrows: Choose to display or not to display the Bullish/Bearish arrows and select the color of the arrows.
9. Inside Days Filter: Excludes taking into consideration inside days/price bars when calculating bullish/bearish, buy/sell arrows. (An inside day, or inside price, is a price bar where the high of the bar is lower than the previous price bar high, and the low of the bar is higher than the previous price bar low.
10. High/Lower Filter: Excludes taking into consideration price bars which have a lower close than its open when calculating a bullish/buy arrow, and a higher close than its open when calculating a bearish/sell signal. (Price bar closed :higher than it opened.) (Price bar closed “lower” than it opened.)
11. Higher/High, Lower/Low Filter: Excludes taking into consideration price bars that do not have a higher close than the previous price bars highe for bullish/buy signals, or excludes price bars that do not have a lower close than the previous price bars low when calculating bearish/sell signals. (Close “higher” that previous price bar “high.”) (Close “lower” than previous price bar “low.”)