
Using Indicators
Reading the Signs and Signals
Overlay Indicators in the Chart Window
There are two Overlay Indicators that can be displayed in the Chart Window, Moving Averages and Bollinger Bands. To select these Indicators, right-click on the Chart Window and select the name of the indicator that you would like to display on the chart.
Moving Average Lines
The moving average, or simple moving average, represents the average of the last several closing prices. The moving average is simple to compute, easy to understand, and reliable under tests. This simplicity is the strength of the moving average.
The basic moving average is computed the same as any other mathematical average. The most common way of determining the moving average of a market is to take the closing price over a certain number of days, add them together, and divide by the select number of days.
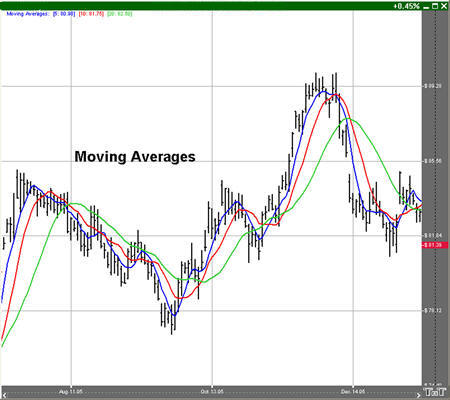
Moving averages are generally thought to be indicators of trend. For example, conventional interpretation is that once prices cross from below the moving average to above it, the trend is considered up. On the other hand, if prices go from above the moving average to below it, the trend of the market is considered down.
The purpose of the simple moving average is to track the progress of the trend. Moving averages can potentially keep you in the trend for a long time. The moving average gives you an indication of the trend being up (prices above the moving average) or down (below the moving average). However, the moving average gives you no indication of the length or duration of the trend.
Double Moving Average
Double moving averages use two different averages in tandem. The first average is generally a faster reacting average using a shorter period of time, usually 10 days. The second average is a slower reacting average that will indicate longer-term price movement.
Using these two averages together helps to alleviate whipsaws by giving a basis of comparison. The faster average breaking above the slower average is a buy signal, the faster average breaking below the slower average is a sell signal.
When using two different moving averages the trader gets a clearer picture of price indications. By combining a slower moving 20-day average, with a quicker reacting 10-day average, you can see where the long-term indications are going.
You would sell once the faster moving average crosses below the slower trend because that’s an indication of change in trend. Near-term prices should be rising at a greater rate than longer-term prices in a good upward trending market, and vice versa for a down trend.
Triple Moving Average
The system of triple moving averages is employed by plotting three different moving averages together. The first of these averages is a faster average that only looks at the short-term price direction. The second average is a medium average that reacts to a longer period of time, but not as long as the final average. The third average is the slowest to react, because it takes an average of the longest period of time.
A 10, 20, and 40 day moving average system would be considered a triple moving average. The first average, the 10-day, is the quickest to move when prices show a change. The second average, the 20-day, is the medium average that does not show change until the prices have moved for a longer period of time. Finally the slowest moving of the averages is the 40-day. This slow average will not indicate a difference until prices have made a significant move. Shorter-term moving averages, being more sensitive to changes in price, are said to follow the trend more closely. The middle or medium average would follow less closely and the slowest or least sensitive average would lag the most.
The use of the triple moving average is to buy when all three averages move to be in an upward trend or to sell when these averages are in a downtrend. The upward trend appears when the fastest average is higher than both of the other averages, the medium is above the slowest, and the longer term moving average is on the bottom.
This look would be reversed for a strong down trend with slow average on top, followed by the medium average, and the fastest on bottom.
Calculation
The calculation for the moving average is here:
Mat = (P1 +... + Pn) / n
Mat: The moving average for the current period.
Pn: The price for the nth interval.
n: The length of the moving average.
Compute the average of the past n intervals using the price specified for that period. Now use real values to compute a five interval moving average. If you assume the following prices, the calculations are here:
MA = (7380 + 7375 + 7385 + 7390 + 7395) / 5
= 36925 / 5
= 7385
The calculation for the Linearly Weighted is here:
Mat = [(P1 x (n –1)] + …+ [Pn x (n – n)]
Denom = n + n-1 + n-2 +…+ 1
MA = Mat / Denom
n: The length of the moving average.
Pn: The price for the nth interval.
MA: The moving average for the current period.
The calculation for the Exponential is here:
fPerc = 2 / (n + 1)
MAt = (P x fPerc) + [MA(t-1) x (1 – fPerc)]
MA: The moving average for the current period.
t: The current time period.
Example of Moving Averages
Preferences
Open the Preference tab from the Control Panel on the left of your screen. Select the moving average line on your screen. The preferences will appear in the Control Panel. (Once you click on the chart, the Preference tab will go back to chart settings.)
1. Restore Settings: TNT Default will change your settings back to the original software settings. My Default will change current settings to your personalized default settings. Apply To All Charts will apply your selected settings on all open charts. Save As My Default will save your current personal settings.
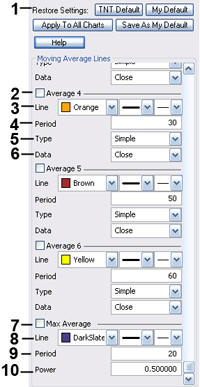
2. Show On Screen Text: Select to see the indicator value on your chart.
3. Placement of Text: Display the on screen text either in the upper left corner of the chart, or the lower left corner.
4. Average: Select the box in front of each average to display up to seven moving average lines.
5. Line: Change the color, line style, and line thickness of the Moving Average lines.
6. Period: To specify the number of days used in calculating the Moving Average indicator, click in the box, highlight the number, and type in a new value. To add a Displacement, add a second number in the period box (with only a space between the two numbers).
7. Type: Change the type of the Moving Average line to simple, linear weight, or extra smoothed.
8. Data: Choose either open, high, low, or close as the data used in calculating the moving average.
9. Max Average Period: Adjust the period of days by which this indicator is calculated.
10. Max Average Power: Adjust the exponentiation by which the max average is calculated.