
Using Indicators
Reading the Signs and Signals
MACD Bollinger Bands
Bollinger Bands are a technical trading tool created by John Bollinger in the early 1980s. They arose from the need for adaptive trading bands and the observation that volatility was dynamic, not static as was widely believed at the time.
In the MACD Bollinger Bands adaptation, the purpose of the MACD Bollinger Bands is to provide a relative definition of high and low levels of the MACD averages themselves, similar to how they are adapted the regular market. By definition prices are high at the upper band and low at the lower band. This definition can aid in rigorous pattern recognition and is useful in comparing price action to the action of indicators to arrive at systematic trading decisions.
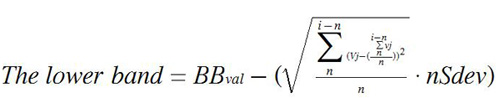
Calculation
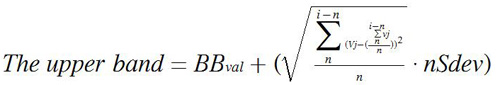
Buy/Sell Signals
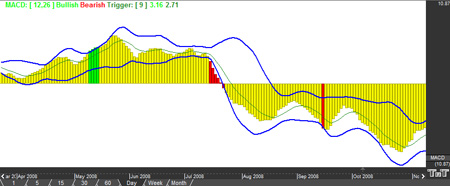
If the MACD Average travels outside the Bollinger Bands either way, that's a signal. A sell signal happens when the MACD Average goes below the band. A buy signal happens when the MACD Average goes above the band.
This is much easier to see if the MACD Average is in line mode.
Example of the MACD Bollinger Bands in the Indicator Window
Preferences
Open the Preference tab from the Control Panel on the left of your screen. Select the Bollinger Bands line on your screen. The preferences will appear in the Control Panel. (Once you click on the chart, the Preference tab will go back to chart settings.)
1. Restore Settings: TNT Default will change your settings back to the original software settings. My Default will change current settings to your personalized default settings. Apply To All Charts will apply your selected settings on all open charts. Save As My Default will save your current personal settings.
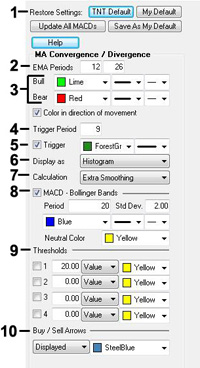 2.
EMA Periods: The MACD is calculated using two
exponential moving averages. To change the periods used in the formula,
highlight the number and type in the new value desired.
2.
EMA Periods: The MACD is calculated using two
exponential moving averages. To change the periods used in the formula,
highlight the number and type in the new value desired.
3. Bull/Bear: Change the color, line style, and line thickness of the Bullish and Bearish lines.
4. Trigger Period: To change the number of days, click in the box, highlight the number, then type in the desired period.
5. Trigger: Check this box to hide the Trigger line. You can also change the color and line style of the Trigger.
6. Display as: The MACD indicator can be displayed differently. From the drop down menu, choose either to view it as a line or as a histogram.
7. Calculation: Choose how you would like your chart calculated. You can choose Standard Calculation or Extra Smoothing. Extra Smoothing is a proprietary formula developed by Lan H. Turner, president and CEO of Gecko Software, Inc. This method increases the movement in the MACD indicator and has shown to be more accurate (in Gecko Software’s market testing) than the standard calculation. Click the Extra Smoothing option to test its accuracy for yourself. Its relationship to the MACD is similar to the relationship between the Fast and Slow Stochastics - think of this indicator as the “Fast MACD.”
8. MACD - Bollinger Bands:
Period - To specify the number of days used in calculating the
indicator, click in the box, highlight the number, and type in a new
value.
Std Dev. - Defines the displacement between the
Bollinger Bands. Click in the box, highlight the number and type a new
value to change the displacement.
Change the color, line style, and line thickness of the MACD - Bollinger
Bands.
9. Thresholds: Gives you the option of displaying four threshold lines, which can be displayed as a value or a percentage in the Indicator Window. You also have the option to change the color of the threshold line.
10. Buy/Sell Arrows: You have the option to display
buy/sell arrows on your chart according to the indicator. Click the
arrow to view Displayed or Not Displayed. You also have the option to
change the color of the buy/sell arrows.