Using Indicators
Reading the Signs and Signals
Volume (VOL) (Stocks only)
Volume is a measurement of the number of contracts traded in a day. It is a sign of market activity. In liquid markets, these numbers will be consistently higher than in a thin or illiquid market. These numbers are always a day behind, because it takes the exchange that long to tabulate these figures. When displayed, Track ‘n Trade Live offsets these values to put them beneath their respective data in the chart, consequently there is not a value for volume for the most recent day of any contract. Volume indicates participation and urgency. This tells the trader which market is the correct one to be in based on its participation.
Volume measures the number of contracts that changed hands during that trading session. This indicator of market activity can show whether trade was heavy or light. That will give you an idea of the possible volatility present in that market. VOL does not give straight buy or sell signals or have set trading rules. Rather it shows the cyclical tendencies of the market. The flow of the underlying market can be represented. Looking at VOL shows whether new buyers or sellers are entering the market or if they are liquidating positions.
There are basic common sense rules for this indicator. If the prices are up and VOL is increasing, the market is strong. If the prices are up and VOL is declining, the market is getting weaker. If the prices are down and VOL is rising, the market is getting stronger. If the prices are down and VOL is declining, the market is getting weaker.
In bull markets, volume tends to increase during rallies, and tends to decrease on reactions. In bear markets, volume tends to increase on declines and decrease during rallies. Trading volume usually increases dramatically at tops and bottoms. Looking at the volume can help you determine the liquidity of the market.

Calculation
This study has no computations. The values for volume are transmitted from the exchanges. However, the actual volume figures are always one day behind price information. You will not know Monday’s volume until Tuesday at approximately noon (for U.S. markets - central time). That is due to the exchanges and their reporting requirements.
Preferences
Open the Preferences Tab in your Control Panel. Select the VOL quick link at the right of the indicator window. (Once you click on the chart, the Preference tab will go back to chart settings.)
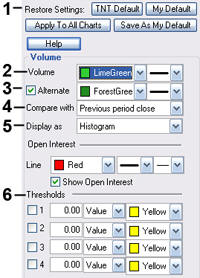
1. Restore Settings: TNT Default will change your settings back to the original software settings. My Default will change current settings to your personalized default settings. Apply To All Charts will apply your selected settings on all open charts. Save As My Default will save your current personal settings.

2. Volume: Change the color, and the line style of the Volume line.
3. Alternate: Select to view the Volume Indicator in two colors. You can change the color and line style as well.
4. Compare with: When the Alternate options is selected you can compare the price day to day based on Previous Period Open: high low, and close, or the Current Period Open: high or low.
5. Display as: View the Volume Indicator as a line, histogram, or filled line.
6. Thresholds: Gives you the option of displaying four threshold lines, which can be displayed as a value or a percentage in the Indicator Window. You also have the option to change the color of the threshold line.
