
Using Indicators
Reading the Signs and Signals
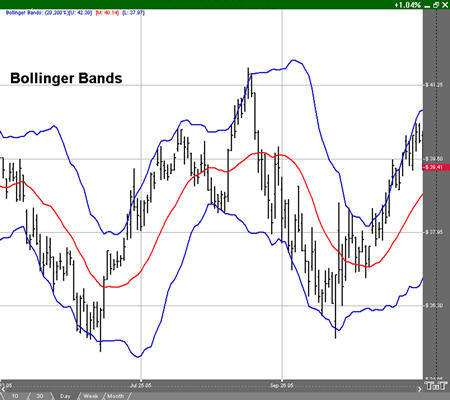
Bollinger Bands
Bollinger Bands are a type of trading envelope. They are lines at an interval around the moving average. They consist of a moving average and two different standard deviations represented as a line above the MA (Moving Average) and a line below the MA. The line above is the MA plus two standard deviations; the line below is the MA minus two standard deviations. Bollinger Bands are used to determine overbought and oversold conditions and to project price targets.
John Bollinger created Bollinger Bands in an effort to gauge the volatility and condition of a market. These bands are used to determine the trading range and give an indication of when to buy and when to sell. Bollinger Bands are also used to indicate market volatility, the wider the bands the greater the volatility. Inversely, the narrower the bands, the lesser the volatility. By plotting two lines at an interval around a moving average, Bollinger bands give a good indication of market conditions and price relation. The moving average which the band is based on works as an indicator to confirm trade signals.
Calculation
Calculate the moving average with this formula:
Subtract the moving average from each of the individual data points used in the moving average calculation. This gives you a list of deviations from the average. Square each deviation and add them all together. Divide this sum by the number of periods you selected.
Take the square root of d. This gives you the standard deviation.
Compute the bands by using the following formulas:
Pn: The price you pay for the nth interval.
n: The number of periods you select.
Buy/Sell Signals
A buy signal occurs when a chart bottom is below the lower band followed by a bottom above the lower band. A sell signal occurs when a chart top is above the uppermost band followed by another top that is below the upper band.
Preferences
Open the Preference tab from the Control Panel on the left of your screen. Select the Bollinger Bands line on your screen. The preferences will appear in the Control Panel. (Once you click on the chart, the Preference tab will go back to chart settings.)
1. Restore Settings: TNT Default will change your settings back to the original software settings. My Default will change current settings to your personalized default settings. Apply To All Charts will apply your selected settings on all open charts. Save As My Default will save your current personal settings.
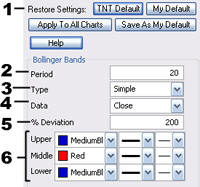 2.
Period: To specify the number of days used in calculating the
indicator, click in the box, highlight the number, and type in a new
value.
2.
Period: To specify the number of days used in calculating the
indicator, click in the box, highlight the number, and type in a new
value.
3. Type: Change the type of the Moving Average line to simple, linear weight, or extra smoothed.
4. Data: Choose either open, high, low, or close as the data used in calculating the moving average.
5. % Deviation: Defines the displacement between the Bollinger Bands. Click in the box, highlight the number and type a new value to change the displacement.
6. Upper, Middle and Lower Band Lines: Change the color, line style, and line thickness of the Bollinger Bands.