
Advanced Technical Tools
Fibonacci, Elliott, Gann, and More
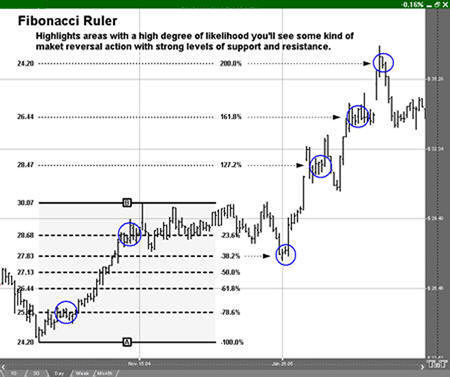
Fibonacci Ruler Tool
![]()
To measure the different retracement levels within a market, select the Fibonacci Ruler tool from your Advanced Charting toolbar. Click on the chart where you would like the ruler to begin. Hold the mouse button down and move to the lower right position of the rule. Release the mouse button to place.
Fibonacci Retracements
Fibonacci Retracement levels correspond with percentage retracements that occur in the ebb and flow of a market trend. According to the Elliott Wave Theory, market trends tend to occur in five distinct waves. See the Elliott Wave section for more information. Elliott asserted that these counter-trend waves will usually retrace against the trending waves by 38.2, 50, and 61.8 percent. These retracement percentages correspond to natural ratios discovered by the Greeks called the Golden Ratio and rediscovered by Fibonacci, a medieval Italian Mathematician.
Interpretation
Commodity prices will frequently consist of an initial wave, a second
wave (often retracing 61.8% of the initial move), a third wave (usually
the largest), another retracement, and finally a 5th wave (the last
gap), which would exhaust the movement.
In Track ‘n Trade Live, you have three tools that you can use to apply these concepts: Fibonacci Retracement, Fibonacci Time Zones, and Fibonacci Arc.
Resizing the Fibonacci Ruler
Select the drawing by clicking on it. You will know the drawing is selected when boxes appear at the corners. Click on a box and drag it to your desired location. Release mouse button to place.
Moving the Fibonacci Ruler
Select the drawing by clicking on it. Drag to the new location and release the mouse button to place.
Deleting the Fibonacci Ruler
Select the drawing by clicking on it. Press the Del (Delete) key on your keyboard. You can also right-click the drawing and select “Delete” from the dropdown menu.
Example of a Fibonacci Retracement
Preferences
Select the drawing by clicking on it. The properties will appear in the preferences section of your control panel.
1. Restore Settings: TNT Default will change your settings back to the original software settings. My Default will change current settings to your personalized default settings. Apply To All Charts will apply your selected settings on all open charts. Save As My Default will save your current personal settings.
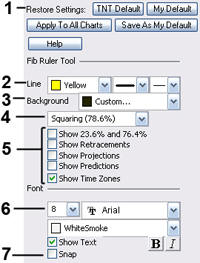
2. Line: From here you can choose the color, line style, and line thickness
3. Background: Select the color you want for the background of the Fibonacci Ruler.
4. Squaring / Division: Choose between displaying the Fibonacci Ruler being calculated as squared (78.6%) or displaying it as a division (76.4%).
5. Show: Select the boxes by the information you would like displayed on your Fibonacci Ruler.
6. Font: Select the font, size of font, and color of the text. You can also choose to bold or italicize your text. Select the checkbox next to Show Text to hide/show your text on the chart.
7. Snap: Select to have the Fibonacci Ruler snap to price bars when moved.