
Getting Started
Navigating Your New Software
Control Panel
The control panel is on the left side of your screen. It includes eight tabs: Charts, Account, Reports, News, Preferences, Data, Notes, and Depth of Market.
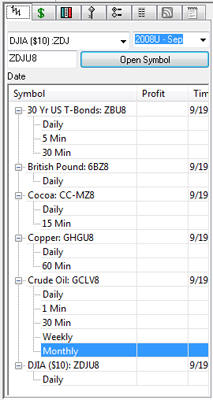
Charts Tab
In the Charts Window you will see all the symbols you have opened, the name of the chart, and the change in price of that chart since it opened.
To view a specific chart at full screen, double click on the symbol in your Charts Window, or right-click on the symbol and select Open Chart.
To delete a chart select it in your Charts Window and hit the delete button on your keyboard, or right-click on the symbol and select Delete Chart.
The more charts you open, the slower your computer will run.
Note: If you find your computer running slow, you may need to break your charts into two or more chartbooks.
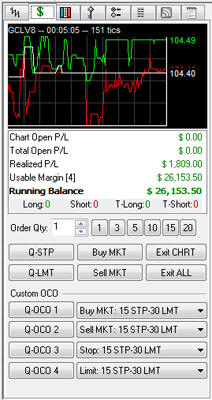
Account Tab
The Chart Quote Window shows a history of quotes. Customize this window by adjusting the Show Change Form to show the change from the Previous Price Bar, Previous Day, or Previous Quote.
Order Placement: Displays details of the order you are placing. The time, date, and market you are buying are determined by the date your chart is played to and what market you have open. Once your order is placed, it will not show in your Accounting Simulator until the order is filled.
Locally Held Order: This type of order is temporarily held locally at your computer. It is only sent as an actual order when the markets meet the proper conditions of your order. Locally held orders are only available in the Forex version of Track ‘n Trade.
Trailing Stop: You can only select this option on a Stop Order. It will follow an open position and protect profits by trailing a market rise or decline. You can choose to set your Trailing Stop by Dollar amount, Price Bars Back, or by following the PSAR or Zig Zag indicators.
Account Overview: View a detailed overview of your current symbol. Includes the ticker symbol, exchange, open/close data, and much more.
The account Statement button will give you access to a detailed tabulation of your account history.
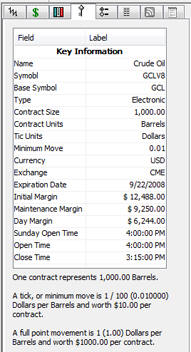
Key Tab
This section displays the key details and data from the contract displayed in the Chart Window. (Terms are explained in depth in the Introduction to Futures chapter.)
Symbol: Gecko Software's symbol for the commodity.
Name: Name of the commodity.
Group: The group is a category for commodities.
Exchange: The exchange is where the commodity's trades are processed.
Contract Size: Number of units that one contract represents.
Contract Units: The unit of measurement.
Tic Size: The tic size is defined as the smallest increment the quote of a contract will fluctuate.
Minimum Move: Tic size represented as a decimal value.
Tic Units: The unit of measure for quotes. This unit should be the same as the unit that the Exchange uses.
Full Point Value: This value represents what a move in the ones place is worth.
Init. Margin: The initial margin for your account.
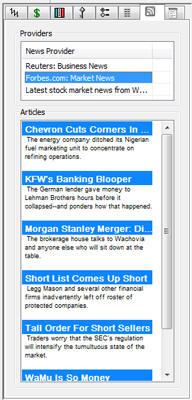
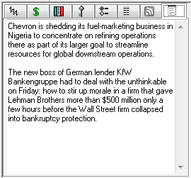
News Tab
The News Tab is a wonderful resource for gathering outside information. Under the Providers section will be a list of the news providers Track ‘n Trade Live is downloading information from. You can add or delete providers from this list by right-clicking on the provider and selecting add or delete. Under the Articles section is a list of articles on the markets. Simply click on them and the article will show in your chart window.
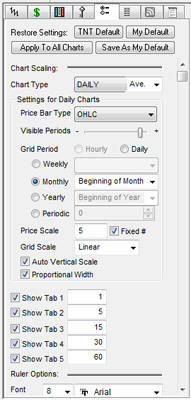
Preferences Tab
The Preferences Tab will help you customize how your chart, and information on it, looks. It will also show the options for customizing Technical Tools and Indicators. There are many different features found on the Preferences Tab.
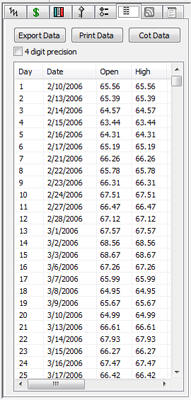
Data Tab
The Data Tab will give you the historical data for each day a specific symbol has traded. It will give you the open price, close price, highest price, and lowest price on the day. It will also show the volume traded. You have the option to print the data for your records, or export the data for use another way. Also, values for indicators are added when the indicator is open.
Notes Tab
The Notes tab is for your convenience to use as a note pad for your research and trading strategy. A separate note pad is provided for each chart.
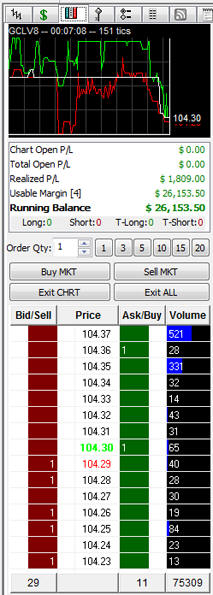
Depth of Market Tab
The DOM or Depth of Market tab is comprised of a multi-colored, multi-column trading tool, where the user can see a sliding scale of market prices. On either side of the market price scale, are columns, one representing the Bid, and the other representing the Ask. The Bid, or Sell side of the market is represented in Red, and the Ask side, or Buy side of the market is represented in green. The market Volume column is on the far right of the price ladder, and represents the volume of contracts traded through that particular trading session, and highlights in blue the volume as a chart.
To place an order to buy the market: Using your mouse pointer, left click the price you would like to “buy” at within the green price ladder. If you click above the market, you will be placing a buy stop at the specified price, if you click below the current market price, you will be placing a buy limit order below the market.
To place an order to sell the market: Using your mouse pointer, left click the price you would like to “sell” at within the red price ladder. If you click above the market, you will be placing a sell limit order above the market at the specified price, if you click below the current market price, you will be placing a sell Stop order below the current market price.
As long as you do not hover your mouse over the price ladder, it will continually update the price ladder and automatically scale the price scale so that the current price is continually centered within the ladder. Once you hover your mouse over the top of the price ladder, the scale will “freeze,” giving you the ability to place your order without having the price ladder move out from under your mouse.